Global Climate Change: Trends and Correlations (1900–2023)
Understanding climate change through data is crucial for assessing long-term trends and their interconnections. This study, created to showcase the application of data analytics in climate research, examines key environmental indicators over the period 1900–2023. By structuring and analyzing historical datasets, we applied a rigorous process covering data collection, preparation, cleaning, analysis, visualization, and reporting to provide meaningful insights into climate dynamics.
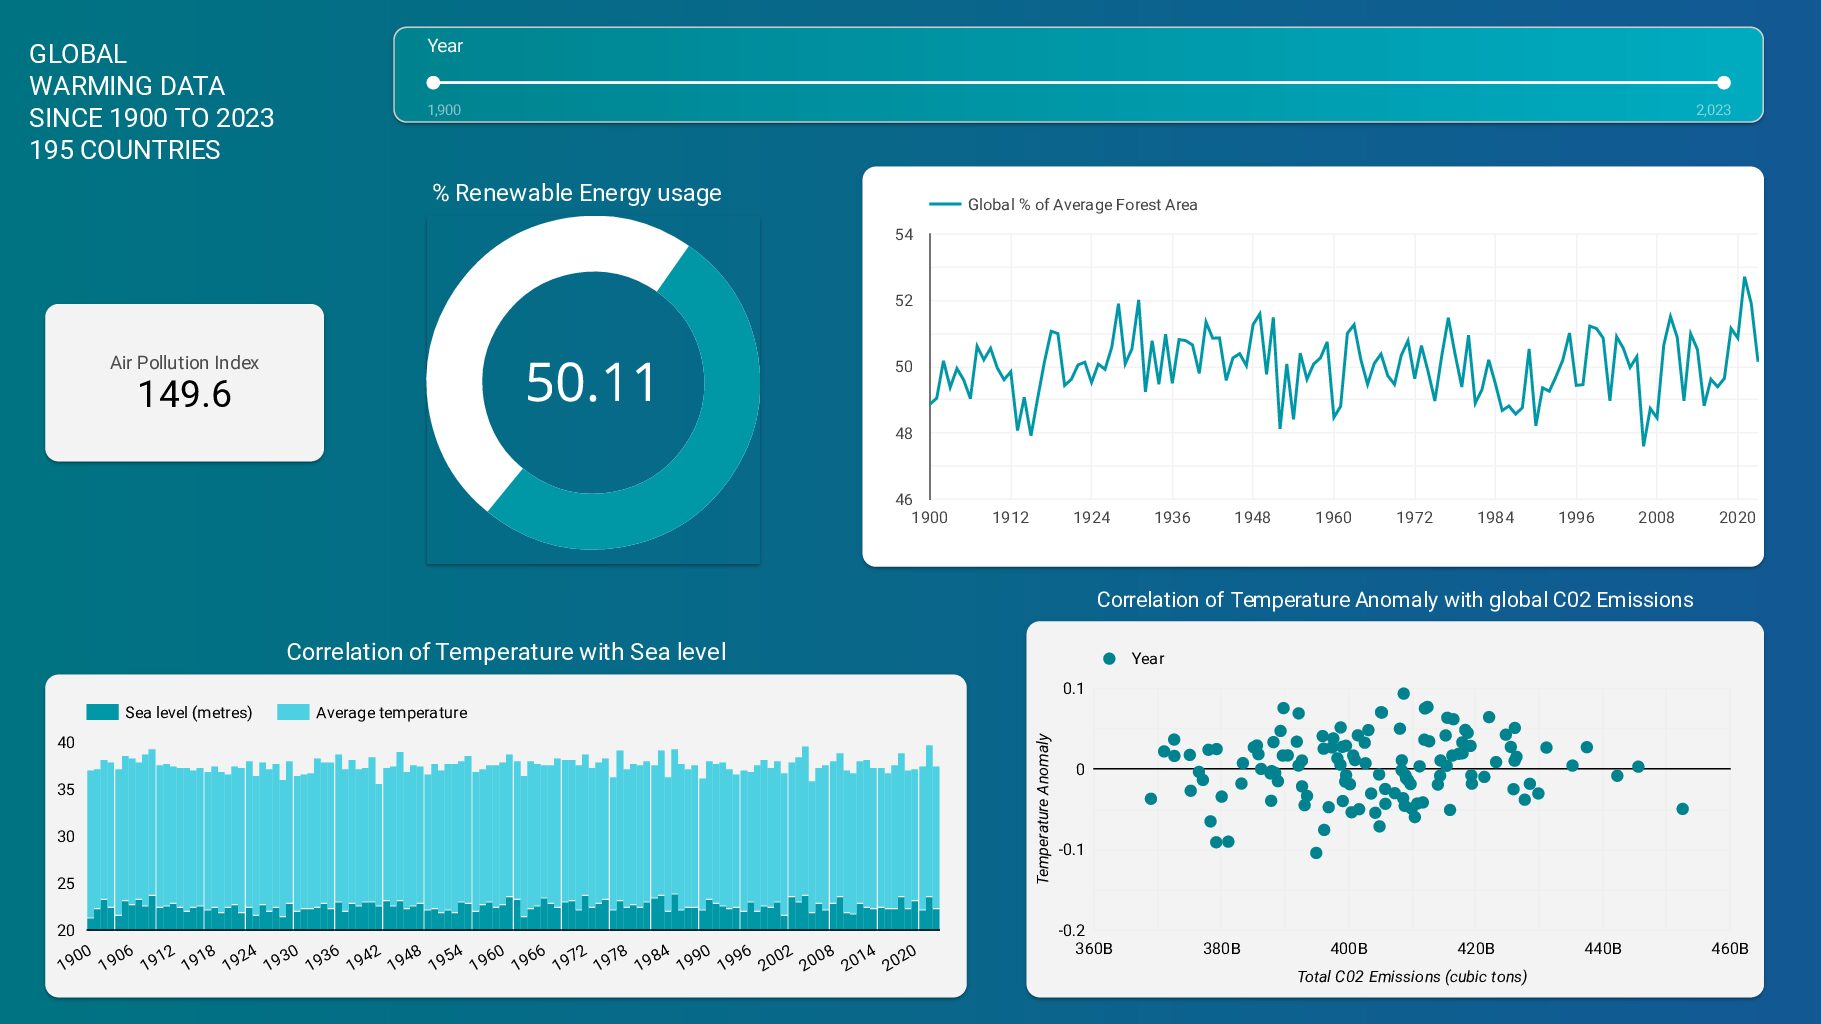
The analysis explores seven key questions: How has the global temperature anomaly evolved over time? What is the relationship between CO₂ emissions and temperature rise? How has the usage of renewable energy changed over the years? What is the trend in sea level rise? How has air pollution evolved? What is the correlation between forest area and temperature anomaly? How has the average global temperature changed? These insights help illustrate the complex environmental patterns shaping our planet.
To support climate research and policy discussions, we provide a cleaned dataset for structured analysis, an interactive Looker Studio dashboard to explore key trends, and a report summarizing the findings on global climate change.
Data
Raw Data – The initial dataset as collected before any transformation. This dataset was sourced from Kaggle, an open online platform providing publicly available data. (Access it on kaggle.com)
Cleaned Data – A refined, cleaned, and normalized version ensuring accuracy and consistency. (Explore it here)
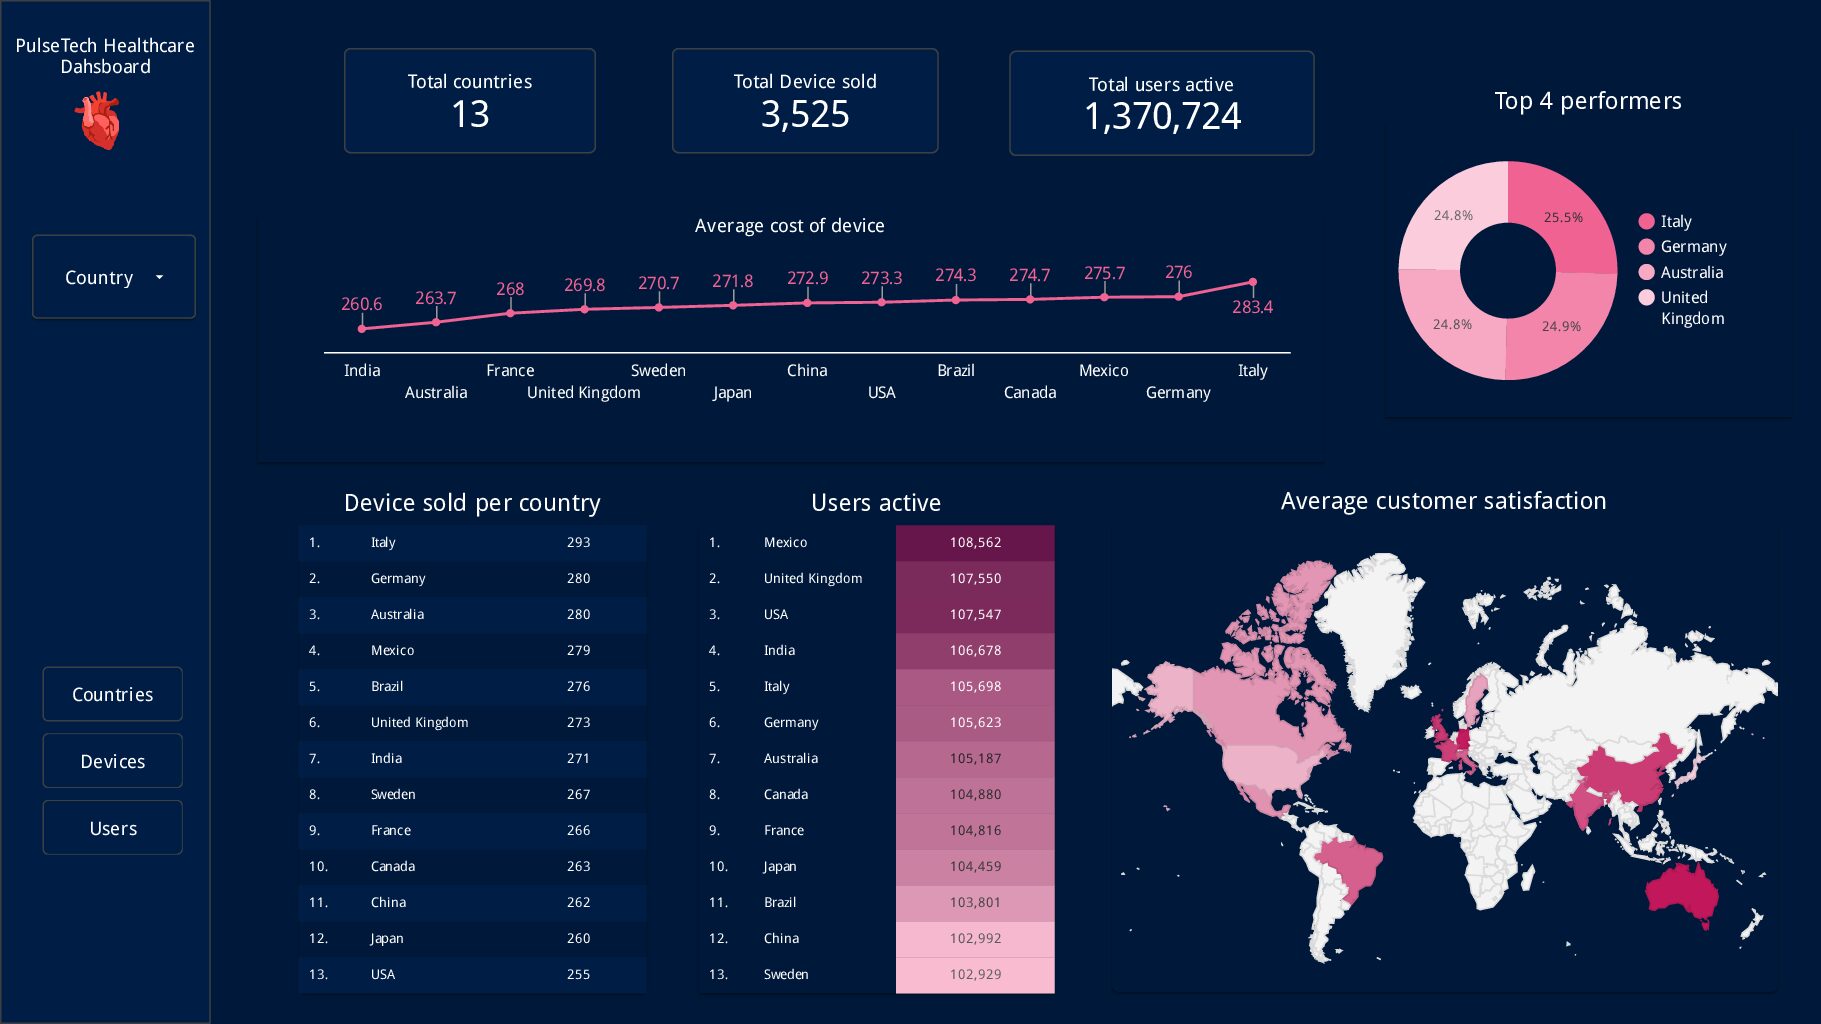
Looker Studio Interactive Dashboard
An interactive dashboard in Looker Studio presents visual insights, trends, and correlations related to climate change. (Explore it here)
PDF Dashboard – A structured visual summary of key climate change trends and their correlations.
Climate Report
This report provides a concise analysis, highlighting key trends, correlations, and observations drawn from the dataset. Explore the complete findings in the PDF below.
This study highlights long-term climate trends and their interconnections, offering valuable insights into the evolving environmental landscape. By leveraging structured data and visualization tools, this analysis supports a better understanding of climate change dynamics and the factors shaping our planet’s future.
We used for this project
Need a business analytics service?
Get in touch and let’s talk about your needs
Check other projects here
- All
- Case Study
- EdTech
- GreenTech
- HealthTech
- Others
- Social impact